Numbers
you can act on.
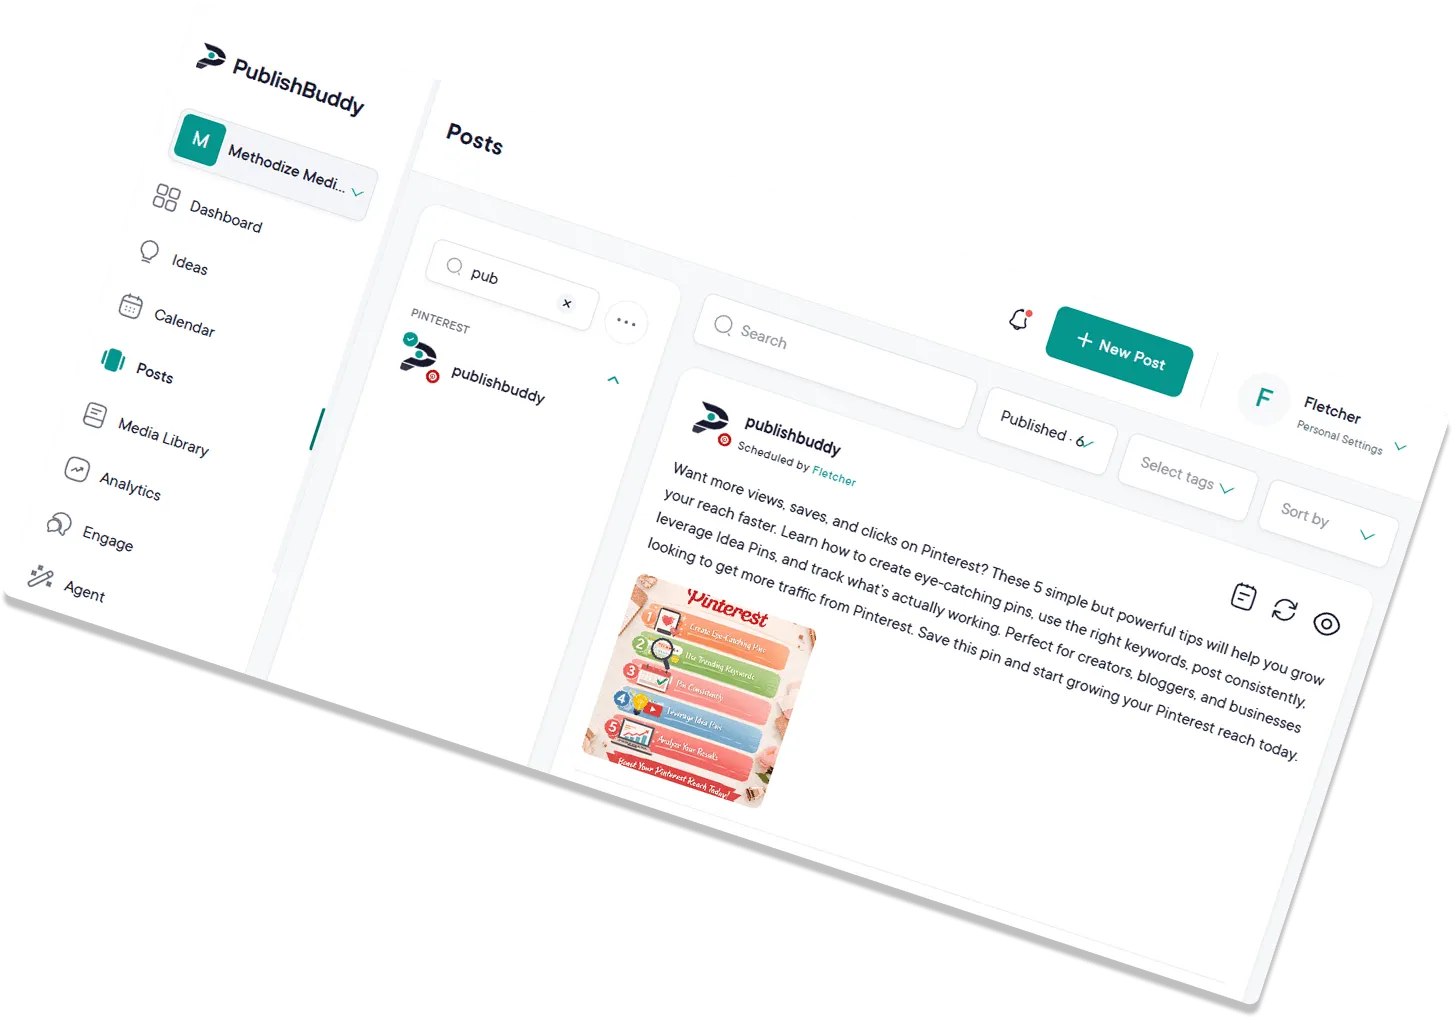
See what's working across every connected account, then double down on the posts, hashtags and times that do best.
Start for Free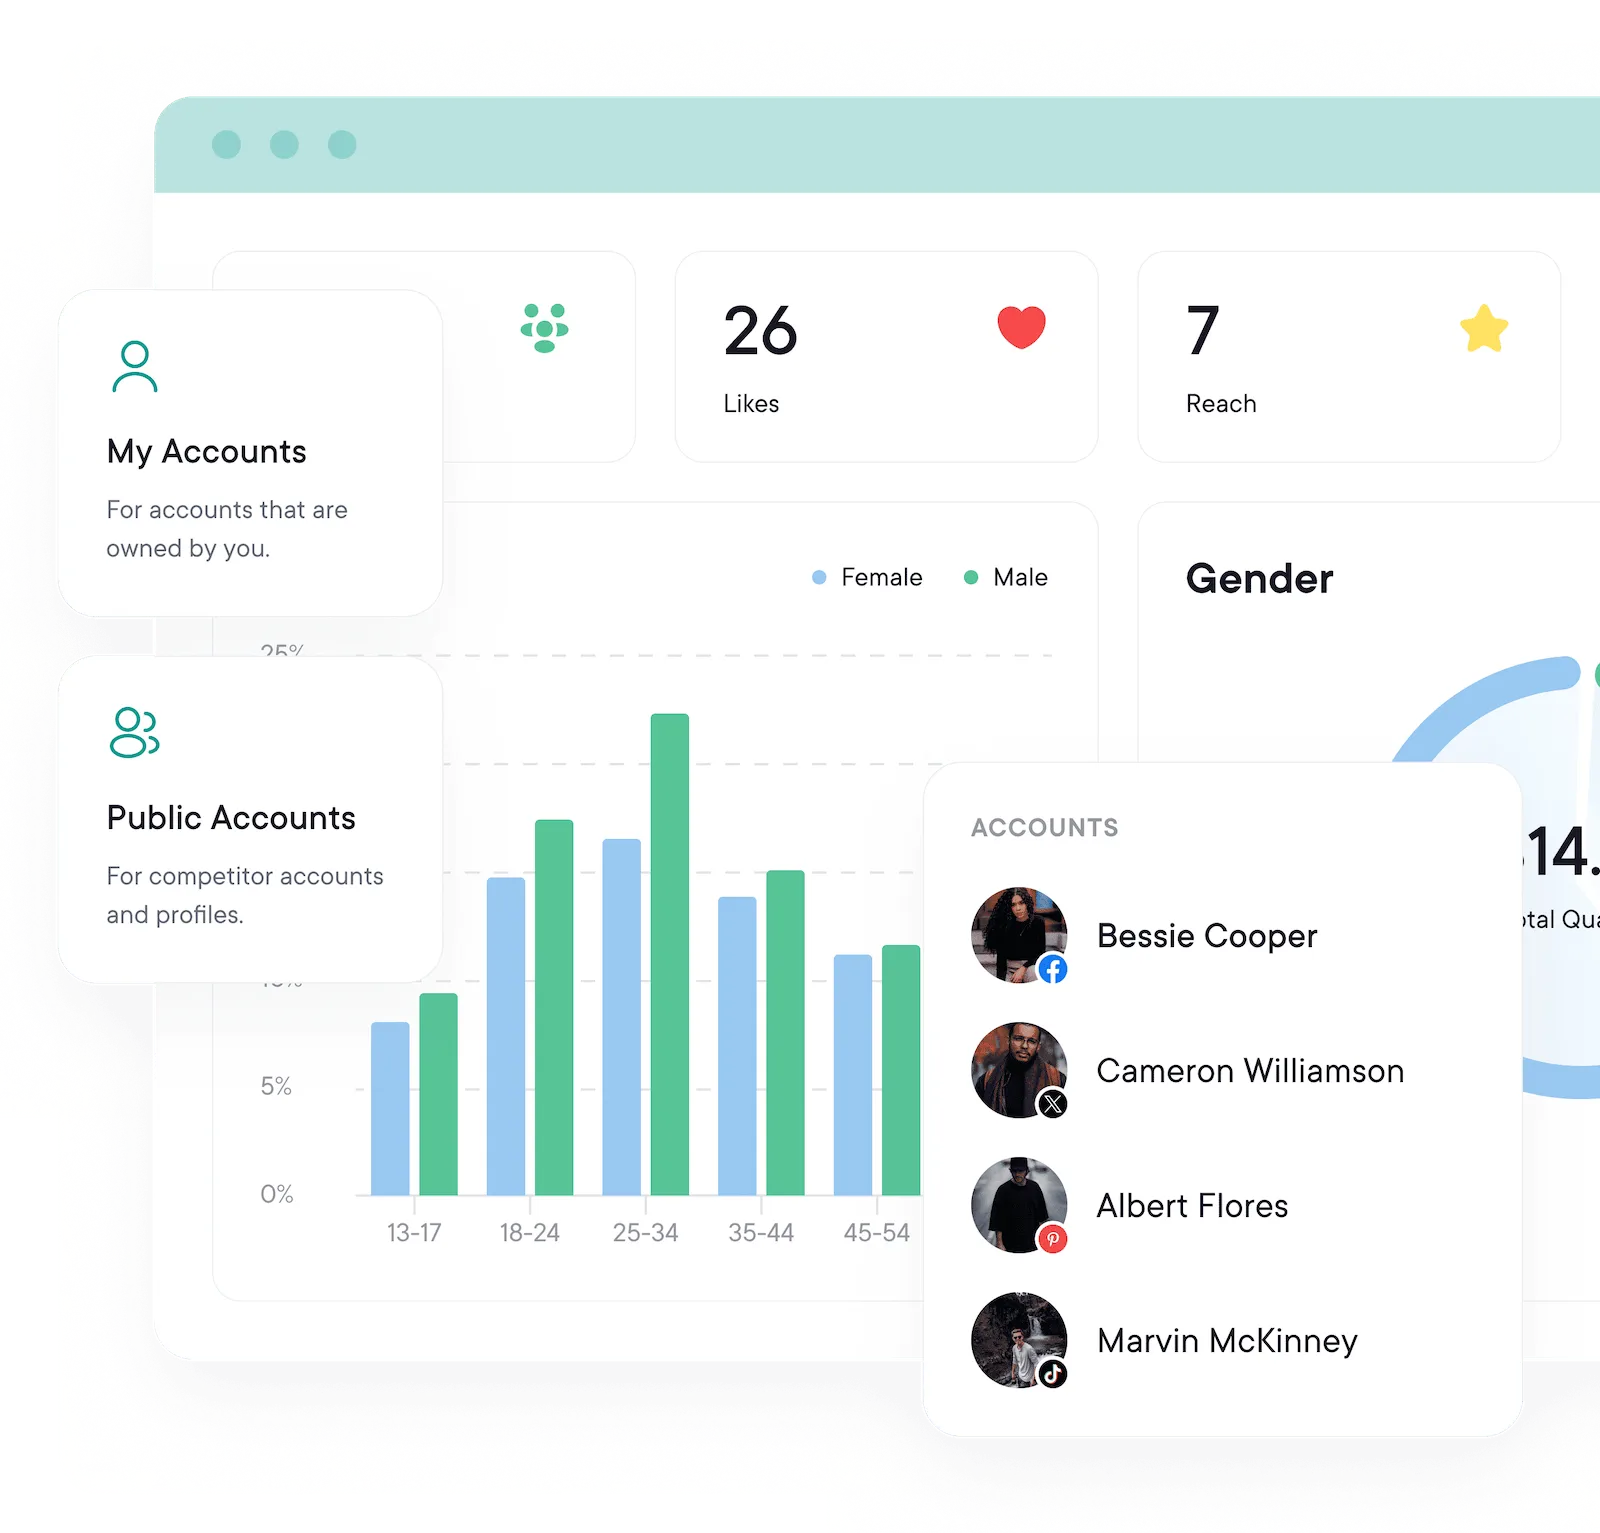
Chart your course with precision.
Every week.
See through
the data.
Track followers, reach and engagement for every connected account in one dashboard. Switch between the last 7, 14, 30 or 90 days so trends are obvious, not hidden in monthly noise.
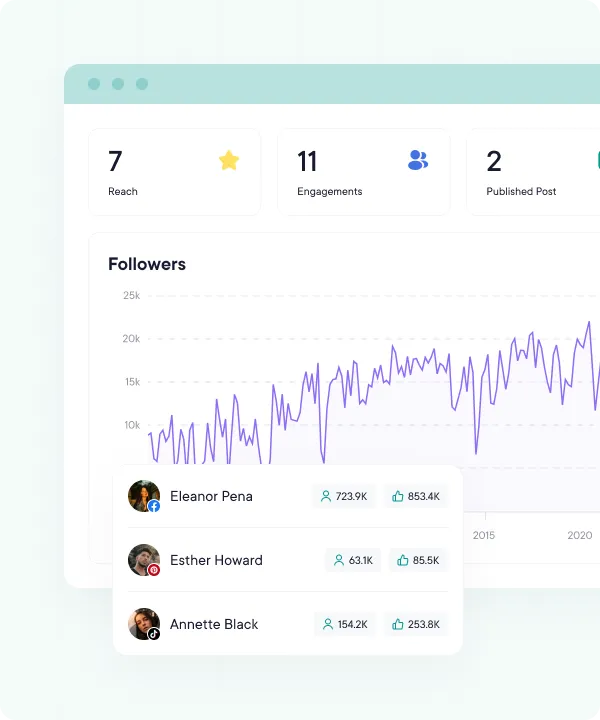
- Follower growth, day by day. Watch the line move and spot which posts came before the jumps, or the dips.
- The numbers each network shares. Reach, likes, comments, shares and views where the network gives them, pulled from each network every day.
- Pick your period. Last 7, 14, 30 or 90 days, this week, this month or last month, each compared with the period before.
Facebook Pages watch list
Learn from the Pages
already winning.
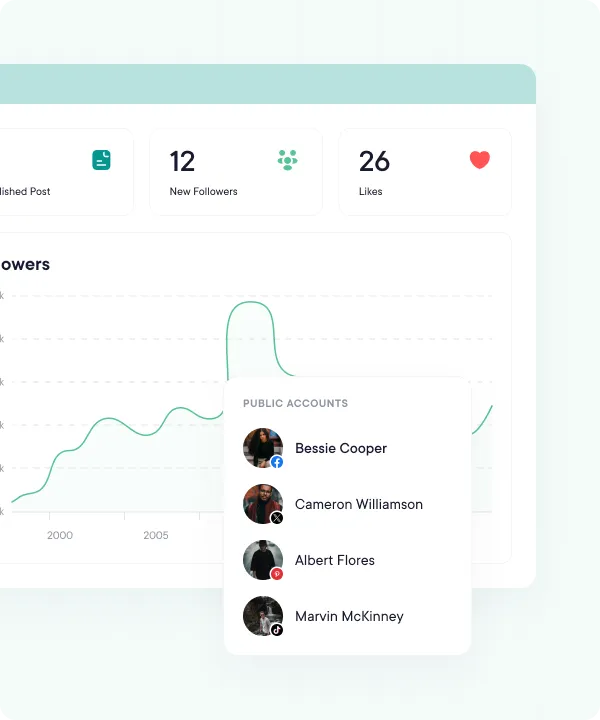
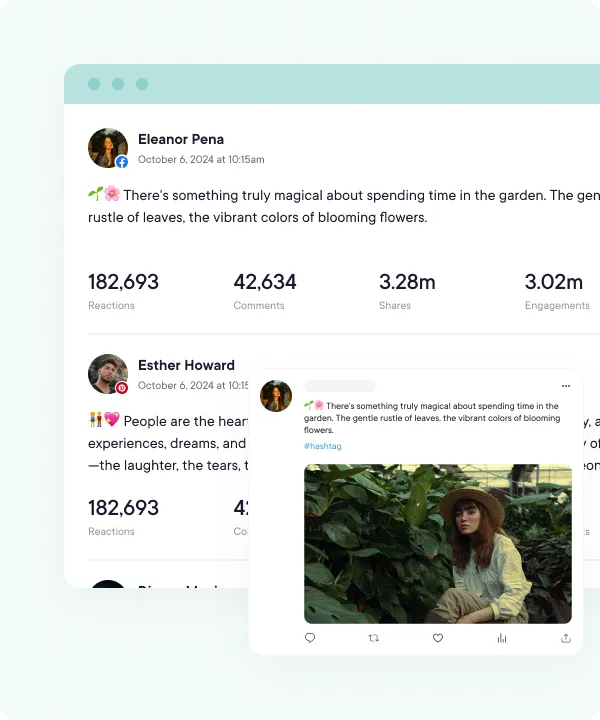
Add the public Facebook Pages you want to learn from to your watch list and keep their posts one tab away. See what they post and which posts earn the most reactions, comments and shares. Then turn the patterns into your own playbook.
- Build a Facebook Pages watch list. Add the public Facebook Pages you want to learn from and keep their posts one tab away.
- See what lands for them. Check the reactions, comments and shares on each of their posts.
- Borrow what works. Spot the formats and topics that get the most response, then try them in your own plan.
Reports & recognition
Numbers clients can read.
Follower growth, engagement and top posts on one page, laid out so the numbers speak for themselves. Open it the moment a client asks for an update.
- Fresh numbers on demand. Owners and admins can click Sync Analytics to fetch the latest numbers instead of waiting for the daily update.
- The numbers people ask for. Follower growth, engagement and top posts, laid out so non-marketers get it on the first read.
- The same numbers in your own tools. Pull them into your own dashboards through the public API or the MCP server on Pro and Business.
Workflows & collaboration
One source of truth for the team.
Bring teammates and clients into the same dashboard so everyone sees the same numbers. No screenshot trails, no matching up spreadsheets.
Strategic insights & suggestions
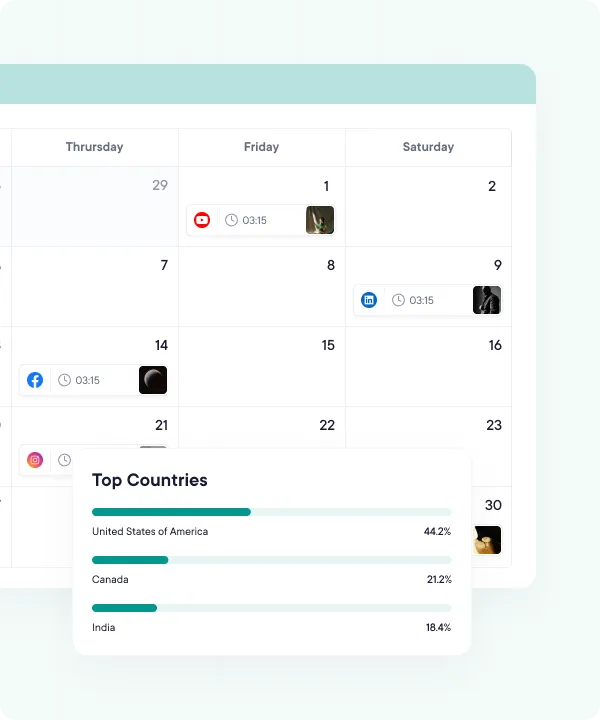
Post when your posts do best.
On Business, a chart built from your own history shows the hours and days your posts got the most engagement. You also get a heads-up when engagement or posting drops, or when followers jump, so you stop guessing and start repeating wins.
Hashtag & content insights
Repeat what works.
See which hashtags bring the most engagement (on Business) and which post types your audience responds to. Skip the guesswork and lean into the patterns in your own numbers, post after post.
FAQs
Quick answers to the questions we get asked most. Can't find what you're looking for? Reach out to our support team and we'll get back to you promptly.
Which plans include analytics?
Numbers on each post show on every plan. The Analytics page, with followers, reach and engagement over time, comes with Pro and Business. Audience details, best times to post, hashtag performance and recommendations are on Business.
Which networks have analytics?
Facebook Pages, Instagram, LinkedIn company pages, TikTok, YouTube, Threads, Bluesky, Telegram and X. X shares no account numbers, so its numbers come from your posts. Pinterest numbers show on each Pin rather than on the Analytics page.
Which date ranges can I pick?
Last 7, 14, 30 or 90 days, this week, this month and the previous month. Each total is compared with the period before it.
How far back does my post history go?
7 days on Free, 365 days on Pro and 2 years on Business. TikTok, YouTube and Bluesky only share today's follower count, so their follower history starts the day you connect.
Why don't my numbers match the network's app?
PublishBuddy fetches numbers once a day, so today's show up tomorrow, and some networks count things differently. Owners and admins on Pro and Business can click Sync Analytics to fetch the latest numbers now.
Can I see the best times to post?
Yes, on Business. Best Times To Post shows the hours and days your posts got the most engagement, built from your own account's history.

Your social media.
One platform.
See what's working. Do more of it.
Join creators, agencies, and businesses who manage their social media smarter. Start for Free, no credit card, no commitment.